October 12, 2018
October 2018 Outlook
AUGUST KEY POINTS
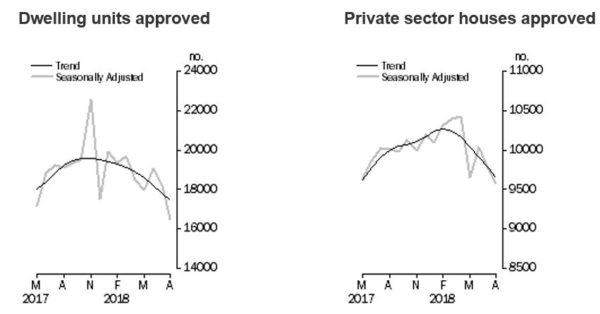
*¹TOTAL DWELLING UNITS
- The trend estimate for total dwellings approved fell 1.9% in August.
- The seasonally adjusted estimate for total dwellings approved fell 9.4% in August
*²PRIVATE SECTOR HOUSES
- The trend estimate for private sector houses approved fell 1.2% in August.
- The seasonally adjusted estimate for private sector houses fell 1.9% in August.
*³PRIVATE SECTOR DWELLINGS EXCLUDING HOUSES
- The trend estimate for private sector dwellings excluding houses fell 2.7% in August.
- The seasonally adjusted estimate for private sector dwellings excluding houses fell 17.2% in August.
______________________
¹ABS
²ABS
³ABS
*⁴VALUE OF BUILDING APPROVED
- The trend estimate of the value of total building approved fell 1.3% in August and has fallen for nine months. The value of residential building fell 0.8% and has fallen for seven months. The value of non-residential building fell 2.3% and has fallen for 13 months.
- The seasonally adjusted estimate of the value of total building approved fell 9.5% in August following a 6.9% rise in July. The value of residential building rose 0.7%, while the value of non-residential building fell 24.5%.
The above charts and supporting evidence from the ABS, should provide an unambiguous view that housing development, purchases and construction has and is weakening. You may have/currently experiencing bank lending conditions changing rapidly. This could be in the form of credit extensions, interest cover ratios increasing, lower LVR ratios and an overall challenge of dealing with a financial institution.
This may be the result of royal commission findings whereby the major lenders are very nervous around any possible negative consequence in the current climate. How long this may last, is a very subjective topic.
So what does this mean for interest rates? We like to look at a balanced view when determining strategy.

Well, as we have previously stated in earlier Interest Rate Outlook reports, we are of the view that there has been a tightening in monetary policy in Australia without the RBA having to raise the overnight cash rate.
Fuel and oil continue to rise in price (not necessarily sure that there is a linear correlation between wholesale cost and retail price), fixed lending rates have increased in the most part (NAB excepted), credit across all segments is more challenging, bank wholesale funding costs have increased as highlighted by the paradigm shift higher in BBSW and subsequent costs being passed on to borrowers. The $AUD is weaker and actually there have been some shifts onshore for manufacturing which we think is a positive outcome.
______________________
⁴ABS
On the topic of manufacturing, our favorite example of the narrow sightedness of recent sitting governments is the example of the motor vehicle industry: –
Australia mines iron ore, ships it offshore at wholesale pricing, has steel manufactured and all the other value added components manufactured offshore and ships a finished product onshore. In the process Australia adds to the global warming footprint and has diminished a skilled manufacturing industry and work force.
Global growth is potentially weaker with the IMF lowering is global economic forecasts, trade wars continue between the US and China, other geopolitical aspects such as Brexit and emerging economies have the potential to affect global growth. We acknowledge the strong economic and employment growth in the US.
So where does this leave our view and potential strategies for interest rate hedging:
We remain of the opinion that the cash rate is less likely to move until sometime towards year end of 2019 on balance. The yield curve, however, will adjust based on factors such as US treasuries values and data releases. We maintain that those borrowers who are proactive in their balance sheet strategies of prudent risk management, will benefit from any possible shocks that may occur.
Even though the official cash rate isn’t expected to move any time soon (by populist view anyway), volatility will occur and we remain committed to the moto of buying straw hats in winter.
For reference, we have provided a yield curve comparison chart from Oct 2017 to Oct 2018.
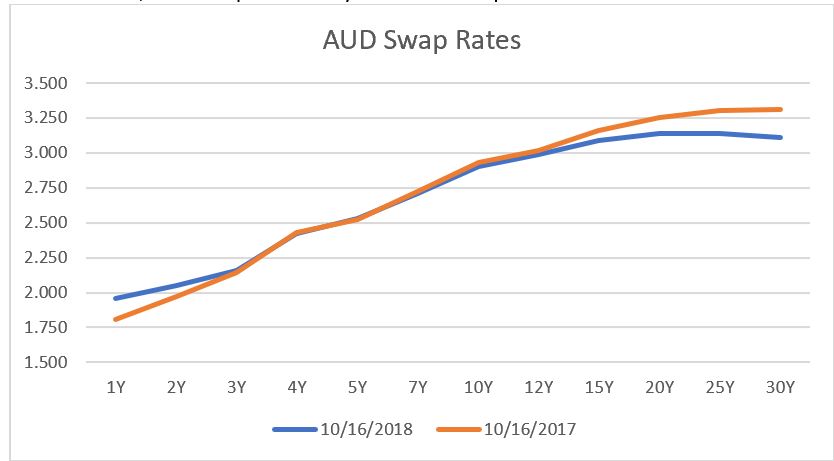
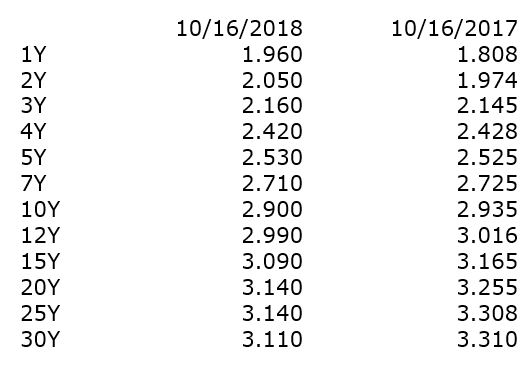
Please note that above rates are all as per market convention which implies that rates greater than 3 years are based on semi annual payments.
As always, please do contact us with our colleagues at Stamford Capital around any strategy, risk management and funding requirements you may have.
Russell Maisner
Director, Global Treasury Risk Management Pty Ltd
Email: Russell@ecommplanet.com
Ph + 61 (0)401 125858